Chart of the Month – Sell in May and go away? or Hedge a quarter and sleep better?
Chart of the month
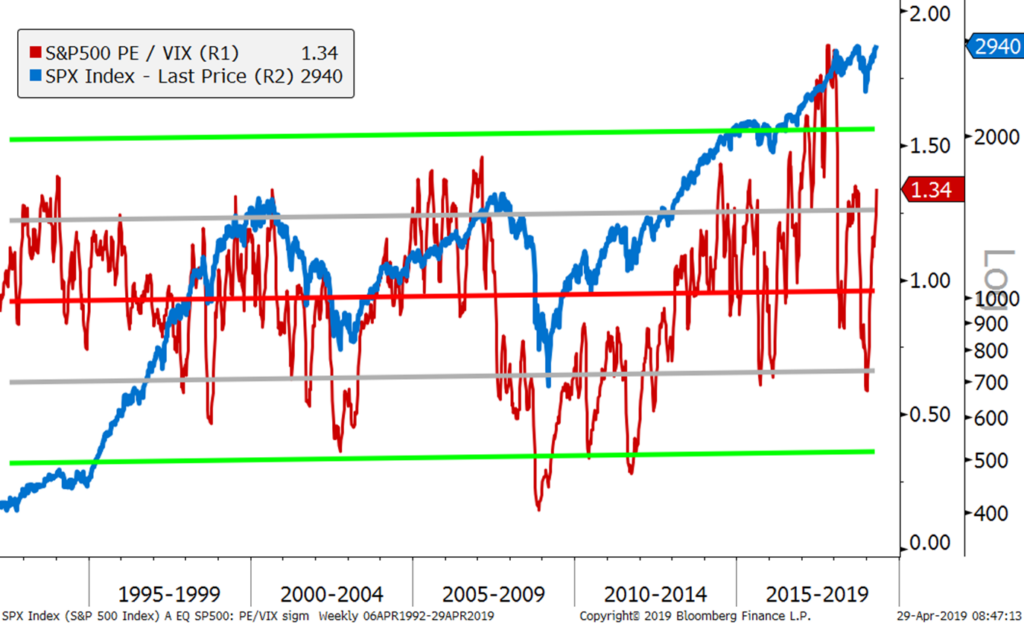
Sell in May and go away? or Hedge a quarter and sleep better?
Source: Bloomberg
It was an extraordinary time to hedge a portfolio (or take profit) in November 2017 when the ratio S&P 500 PE/VIX reached 1.80 and was close to 3 standard deviation away from its mean (refer to our November 2017 Chart of the Month).
It was a great time to hedge a portfolio in September 2018 when this ratio reached 1.35 and was trading more than 1 standard deviation away from its mean.
After the very strong equity markets recovery this year, is it now also a good time to hedge a portfolio now that this ratio is back to 1.34 level?
Buying a put is always “too” expensive, unless your get the timing right with short maturities. It is all about finding the right balance between the underling, the maturity, the strike price and the volatility.
Whilst there are good reasons to continue to be bullish in the near term (central banks have changed policies to be more accommodative, earnings growth remain solid, global inflation is contained, trade negotiations are progressing…), we think now is a reasonable time to hedge a portfolio.
As an example: a 2% out-the-Money PUT on the S&P 500 Index with a December 20, 2019 maturity costs today about 3.3%. Therefore you can reduce your portfolio risk by 25% (or a Quarter) at a cost of 0.83%. In addition, to reduce the risk of timing, you could scale in over the next few weeks.
As the old adage says “Sell in May and Go Away”, we think it makes more sense to hedge a quarter and sleep better with an end-2019 horizon. It is a good way to remain invested with an insurance which cost is only the performance of the last 2 or 3 weeks.
Chart of the Month – Active Management: being at the right place at the right time
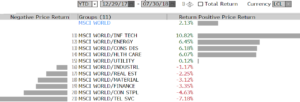
2018 – Active Management: being at the right place at the right time
French coach Didier Deschamps had to be very selective with his players and implement the right strategy to win the World Cup 2018.Active management is like soccer, you have to be a the right place at the right time. Active management is the right strategy for the second year in a row where investors had to be very selective.
Source: Bloomberg
While most markets are down for the year as seen here below:
MSCI Emerging Markets
5.90%
Nikkei
0.90%
DJ Stoxx 50 Europe
0.90%
Bloomberg Barclays Global Aggregate Total Return
1.60%
most stock pickers and hedge funds are up by having a bias towards investing in the US (Dow Jones is up +2.38% YTD) and more importantly by being in the right sectors: Information Technology is up over 10% and Energy, Consumer Discretionary and Healthcare are all up above 6%.
While the MSCI World index USD is up +2.13% for the year, the spread between the best and the worst sector is more than 17.0% (as seen above).Despite the remaining political risks from Europe and the Trump administration, financials markets have now been rational for more than two years. Earnings and corporate activity are driving the stock markets and NOT macro fears such as EUR breakout, China hard landing and Oil collapse for instance.
We expect this environment to continue where active management should outperform passive index investing.
Chart of the Month – “Something’s gotta give”
CHART OF THE MONTH
“Something’s Gotta Give”
Source: Bloomberg
Something’s Gotta Give is a 2003 American romantic comedy starring Jack Nicholson and Diane Keaton who find love for each other in later life, despite being complete opposites.
Why is the USD so weak recently despite the 10-year interest differential between the US and Germany indicating the opposite? This spread which historically has been a good indicator has increased since November as US interest rates have gone up more than their German counterparts.
The USD dollar could be weak because of expected increasing budget deficit and a weak perception of the Trump administration. The EUR could be strong because of stronger than expected European economic activity, foreign investors’ interests in buying European assets and or market expectations that the ECB will soon move towards reducing its monetary accommodation.
The USD is now clearly oversold by any technical indicator but German interest rates are probably one of the most missed priced asset as a result of quantitative easing.
So something will have to give! Being long the USD while shorting 10-yr German bund and buying 10-yr US Treasuries could be the way to play this convergence.
Hedge Funds: Myth Vs Reality
La CFA Society of Mauritius et Notz Stucki Origins Limited ont fait une présentation sur le thème ‘Hedge Funds : Myth vs Reality’. Sébastien Poiret, Managing Director de Notz Stucki Origins, a dressé un tableau de la performance de ces fonds tout en évoquant l’environnement de « bull market », qui persiste depuis neuf ans maintenant au niveau des marchés actions. Il explique aussi pourquoi peu de ces fonds investissent, pour l’instant, sur la Bourse de Maurice.
Sébastien Poiret, Managing Director de Notz Stucki Origins
En termes simples, expliquez-nous ce que c’est que les ‘hedge funds’.
Ce type de fonds est un fonds d’investissement qui peut faire de l’argent quand les marchés montent, ce qu’on appelle le ‘long side’. Là où c’est particulièrement intéressant, c’est qu’il est aussi censé faire de l’argent quand les marchés baissent, ce qu’on appelle le ‘short side’, et a la possibilité d’utiliser un peu d’effets de levier. Donc, prendre un peu plus de risques sans forcément investir uniquement dans les actions et les obligations. Mais il peut aussi investir dans les marchés de devises et de matières premières. Il y a plus de 30 stratégies différentes. Cela donne beaucoup plus de flexibilité que les investissements traditionnels en actions et obligations. Il permet, sur de longues périodes, de surperformer les marchés des actions avec moins de risques ; ce qu’on appelle la volatilité, et moins de corrélation.
Vous avez débuté votre présentation en citant « l’environnement actuel », et en utilisant des termes comme « bulle ». Que devons-nous comprendre ?
Cela fait maintenant neuf ans que nous sommes dans un environnement de « bull market » pour les marchés des actions. Ce cycle dure, en général, entre cinq et huit ans. Celui-ci est un peu plus long que d’habitude. Ce qui n’est peut-être pas surprenant puisque la crise de 2008 a été tellement violente que le cycle est désormais plus long. On commence effectivement à avoir des bulles qui nous font peur, notamment dans les marchés obligataires, les marchés de crédit où les sociétés à haut rendement se refinancent à hauteur de 2 ou 3% en Europe. Ce qui paraît complètement fou. Il faut comprendre aussi que le cycle actuel ne va pas durer indéfiniment, et que l’intérêt et l’appétit pour les ‘hedge funds’, à travers des fonds de ‘hedge funds’, sont en train de revenir.
Pour reprendre une question d’une personne dans l’audience, devons-nous nous attendre à un crash comme en 2008, et éventuellement un impact sur les ‘hedge funds’?
Un crash comme 2008… Pas forcément. Pour l’instant, tous les signaux sont au vert. La croissance mondiale est bonne et elle est synchronisée. Les résultats des entreprises sont bons. L’inflation est contenue. Donc, l’environnement actuel est bon et nous ne serions pas surpris que la hausse des marchés continue. Pour l’année prochaine, le risque principal, c’est l’inflation. Pour l’instant, elle nous surprend tous, car elle reste contenue. Mais si jamais elle grimpe, les banques centrales devront être plus actives et donc plus restrictives ; ce qui pourrait impacter les marchés obligataires et de crédit.
Maintenant on est persuadé que l’industrie des fonds alternatifs est beaucoup mieux positionnée actuellement qu’en 2008 parce qu’elle a appris de ses erreurs. Donc, pour vous donner une idée sur les portefeuilles équilibrés de nos clients, nous avons investi jusqu’à 30% dans ces fonds à travers nos fonds de ‘hedge funds’, dont le plus ancien a 43 ans de « track record ».
Justement, vous dites que l’industrie a appris de « ses erreurs ». Quelles ont été ces erreurs ?
Il y en a trois principales. La première, c’est le levier. L’industrie utilise beaucoup moins de leviers qu’en 2008, et les banques leur offrent moins de leviers. Deuxièmement, ces fonds utilisent maintenant plusieurs ‘prime brokers’, et donc ne dépendent pas d’un seul ‘prime broker’ qui, à l’époque, le forçait à vendre leurs positions au milieu de la crise. Enfin, beaucoup de ces ‘fund managers’ ont aussi appris des erreurs d’investir dans des investissements non liquides, qui sont devenus des investissements importants suite à des performances négatives et des rédemptions. Nous sommes vraiment confortables aujourd’hui avec un portefeuille de ‘hedge funds’ diversifié qui ne gagnera pas forcément de l’argent si une crise similaire à 2008 se reproduirait, mais qui ferait beaucoup mieux qu’en 2008.
Les marchés émergents intéressent-ils toujours les investisseurs ?
Depuis un an et demi, oui. Depuis que les marchés émergents ont bien rebondi, la liquidité est de retour. La croissance des bénéfices est aussi réelle et les valorisations sont encore intéressantes. Donc, on ne serait pas surpris que les marchés émergents – à condition que le dollar ne remonte pas trop et que les taux d’intérêts aux états-Unis ne remontent pas trop non plus, car les pays émergents, très sensibles au dollar et au taux d’intérêt, continuent de bien « performer ».
Est-ce que, finalement, l’industrie des ‘hedge funds’ reste une industrie compliquée et difficile à comprendre ?
C’est une industrie qui est plus complexe et plus sophistiquée ; mais à partir du moment où on a l’expertise, les bonnes équipes de gestion et les bons processus, nous sommes très confortables. Toutefois, il faut être très sélectif. Nous faisons du ‘due diligence’ au niveau de l’investissement, et au niveau opérationnel parce que le ‘hedge fund’, ce n’est pas uniquement investir de l’argent. C’est aussi gérer une société. On veut s’assurer que dans un ‘hedge fund’, il y a le Chief Executive Officer (CEO) qui s’occupe de la société, un Chief Operating Officer pour les opérations, un Chief Risk Officer indépendant en plus, naturellement, du CIO et des Portfolio Managers qui prennent les décisions d’investissements. Certains « hedge funds » ont plusieurs centaines d’employés.
Nous faisons en plus de ces deux « due diligence » de l’analyse quantitative/statistique sur les performances passées. Ce sont donc trois équipes différentes et trois rapports différents qui permettent à nos Portfolio Managers de prendre les décisions d’investir dans des ‘hedge funds’. Nous avons des contacts très réguliers avec eux, notamment en allant les visiter sur place plusieurs fois par an, que ce soit à Londres, à New York ou en Asie.
Donc, oui, de loin, ça paraît effectivement assez opaque et compliqué. Mais quand on a fait ça depuis plus de 40 ans, et surtout qu’on a investi depuis 40 ans dans les fonds alternatifs, on les comprend bien.
Messieurs Notz et Stucki ont eu la chance et le flair d’investir avec Georges Soros au début des années 70, et qui est devenu, depuis, le ‘hedge fund manager’ qui a connu le plus de succès. Ils ont été, avec d’autres partenaires en Suisse, les pionniers des fonds de fonds alternatifs.
Où se situe Maurice à l’échelle internationale par rapport à l’industrie de ces fonds?
Il y a très peu de ces fonds qui investissent sur la Bourse mauricienne. Plus le marché local va se développer, plus le marché va devenir liquide et plus certains ‘hedge funds’ vont investir dans la Bourse locale au niveau des actions, mais aussi à terme au niveau des obligations. Dans la région, il existe un certain nombre de ces fonds en Afrique du Sud, qui traitent le marché local. Il y a des fonds qui investissent dans l’Afrique subsaharienne. Il existe, dans la région, peu d’investisseurs dans ces fonds. Il y en a eu en 2008, et certains ont été déçus. On est persuadé que, même dans la région, l’intérêt pour les ‘hedge funds’ ne va que grandir dans les mois et les années à venir.
Parlez-nous de Notz Stucki Origins, et de votre stratégie qui, à ce qu’on comprend, est principalement régionale.
Notz Stucki Origins est une ‘joint-venture’ entre le groupe Notz Stucki (USD 9 milliards d’actifs sous gestion) et Origins Limited, le ‘family office’ de M. Gauthier Ismail. En tant que société de gestion indépendante, nous gérons de la clientèle locale et régionale et proposons à nos clients de réinvestir une partie de leurs avoirs dans leurs pays d’ «Origins ».
Texte: Herrsha Lutchman-Boodhun
Chart of the Month – It has never been a better time to hedge your YTD performance!
Source: Bloomberg
It has never been a better time to hedge your YTD performance!
The S&P 500 Index is currently trading at all time high after being up +14.75% YTD and over +20.0% in the last 12 months.
S&P 500 90-day realized volatility is now trading at the low range of the last 27 years at just 7.0%.
The S&P 500 Price Earning ratio divided by the VIX index is at 1.75, which is by far the highest level during the same 27-year period.
Our conclusion is that is has never been that cheap to hedge a portfolio, especially to hedge YTD performance with a 3-month time horizon, where implied volatility remains very attractive.
As an example: a 2% Out-of-the-Money PUT on the S&P 500 Index with a January 18, 2018 maturity will cost you today about 1.2% with an implied volatility of just 10.0!
Chart of the Month – Active management is back but beware of the next equity sector rotation!
Active Management is back but beware of the next equity sector rotation!
Source: Goldman Sachs
After a tough 2016, active managers (long-only stock pickers and hedge funds) are back in business and outperform their benchmark since November of last year.
This is due to two main reasons:
Number 1: Sector and stock correlation have come down to levels where active managers are able to generate positive performance and alpha. The global equity markets are now less driven by macro-economic factors (such as Oil, USD and China for instance) and central banks news. These markets seems more rational and driven by bottom-up stock specific news such as earnings and events.
Number 2: The sectors which are driving performance this year (which is actually the mirror image of 2016 at the same time, see below) are IT, Healthcare and Consumer Discretionary. These sectors are currently favored by active managers and they tend to avoid (or go short if they can) sectors such as utilities and telecom. But beware of such outperformance in the short run, they tend not to last for too long. Wouldn’t it be wise to start taking some profit in these leading sectors?
Chart of the Month: US Healthcare sector, an appealing opportunity?
US Healthcare sector : an appealing opportunity?
Source: Bloomberg
The US Healthcare sector is comprised of Pharmaceutical, Biotech, Medical Equipment and Hospital companies.
Due to Hilary Clinton’s Tweet in 3Q15 to restrict pricing policies, this sector has corrected with high volatility. Despite that, earnings continue to grow steadily: +12% annualized growth over the last 3 years and expected to grow on average +10% per year in 2017 and 2018.
This sector now trades at a Price/Earnings Ratio of 14.4 which is 13% cheaper that the S&P500 Index itself (16.5 times), and such with higher earnings growth!
Hilary Clinton is now likely to win the White House but the House is likely to remain on the Republican side. She therefore won’t be in a position to implement some of her feared changes.
If this is the case, less uncertainty will soon be reflected with higher share prices, as long as earnings don’t disappoint!
Large Biotech companies could be of particular interest.
Chart of the month: Why is active management underperforming this year?
WHY IS ACTIVE MANAGEMENT UNDERPERFORMING THIS YEAR?
2016 has so far been a difficult year for active managers (long only stock-pickers and hedge fund long/short equity managers).
If we take the US equity markets as the main proxy we see that the MSCI USA Index is up just +1.3% for the year. It does not really reflect the reality of what happened at the sector level.
The difference between the best performing sector (Telecoms & Utilities +11.1%) and the worst performing sector (Information Technology -3.9%) is 15.0% as of today.
At the bottom of the markets on February 10th, while the MSCI USA index was down 11.0%, the difference between Telecoms & Utilities and Financials was 22.0%, only 6 weeks into the year!
The biases for a large number of active managers was to be long Information Technology, Healthcare and Consumer Discretionary where there was and still is good growth (both top line and profit) and to be underweight or short (for hedge funds) Telecom & Utilities, Energy & Material and Industrials (mostly as Oil collapsed from over $100 to as low as $26).
So that fact that equity markets sold off sharply in a short period of time (where managers had to risk-manage their books by often reducing exposures) coupled with this large sector rotation have been detrimental to performance. Concerns about global growth, the sharp up-reversals of Oil and Gold and the crowdedness of some stocks and sectors have been the main reasons for these moves.
Equity market volatility has recently decreased and global equity markets have recovered. We think that fundamentals are slowly taking over and that rationality is coming back which should benefit active management.
Difficult to call a bottom in such a complex sector which is exposed to political risk, but there are some reasons to believe that there is an attractive asymmetrical risk profile for buyers in the biotech sector, one of the few growth sectors in the current macroeconomic environment.